KISSmetrics: Announcing the Updated Kissmetrics Funnel Report
KISSmetrics: Announcing the Updated Kissmetrics Funnel Report |
| Announcing the Updated Kissmetrics Funnel Report Posted: 03 Oct 2016 12:49 PM PDT The Kissmetrics Funnel Report is our most popular report, and for good reason. Seeing where potential customers drop off and segmenting traffic to find the most valuable marketing channels are game changers for businesses. And today we're announcing new features in our Funnel Report that will make it even more powerful. Let's start with the new design. 1. More Flexible DesignPreviously in the Funnel Report you’d create steps horizontally, like this: 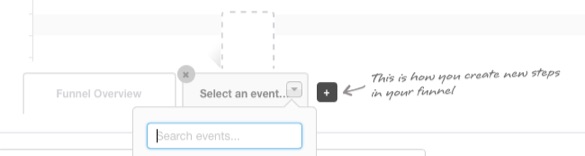 Now, to be consistent with the design of our People Search, we’ve changed the layout so you'll create steps vertically, like this: 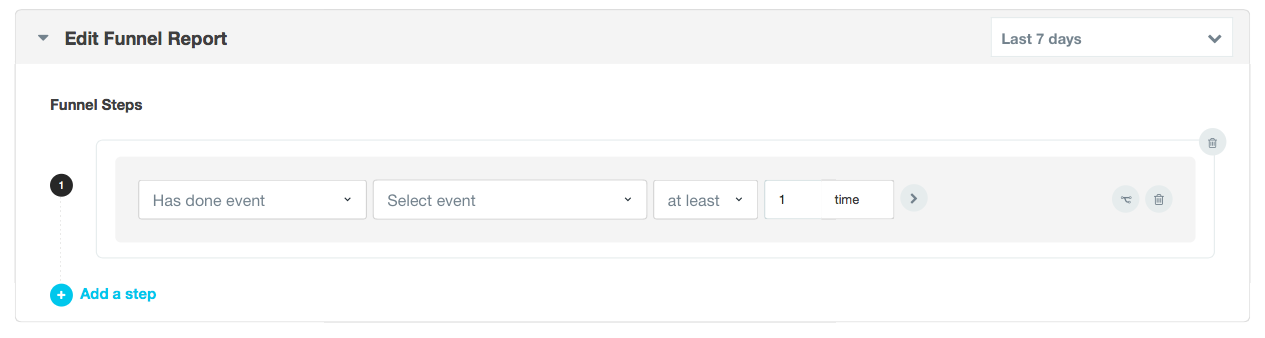 This new design flow allows for greater flexibility of some new features we’ve added (more on that later). The visualization has also been updated. Instead of seeing something like this: 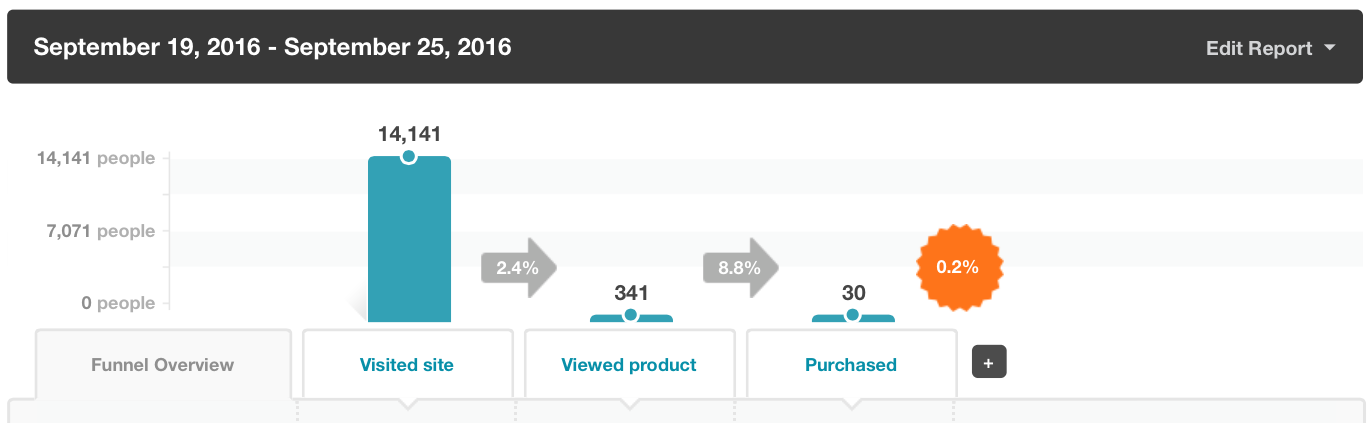 You’ll see this: 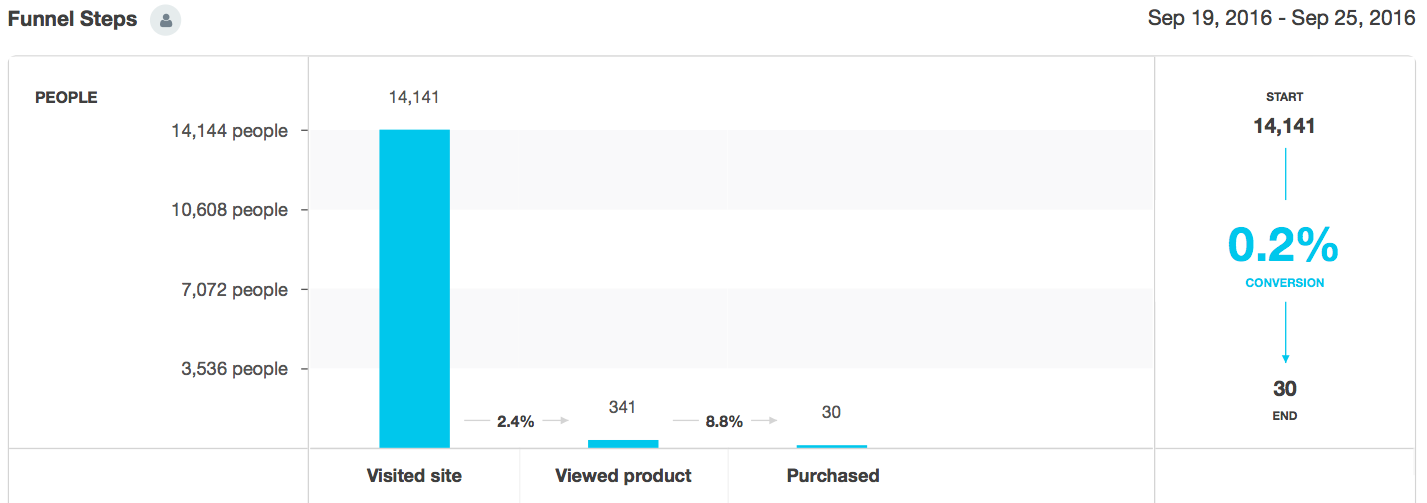 Finally, many of our customers have four or more steps in their funnel. In our previous Funnel Report, there was no way to easily see a funnel with five or more steps. Now it’s as easy as scrolling side-to-side to view additional steps:  2. Drag and DropDid you accidentally create your steps in the wrong order? With the drag and drop feature, you don’t have to go back, delete steps, and then re-create them. You just drag and drop the steps into the correct order.  3. And/Or ConditionsLet’s say you’re a marketer for a SaaS company. You have two ways for visitors to get in touch with your sales team. They can request a demo or sign up. You want to know which one is more effective at driving people to start paying for the product. Now you’ll be able to see people who have done both events or one or the other. So, in our case, we’ll create a funnel report that looks for people who have visited the site and then signed up or requested a demo. We’ll create our first step, Visited site, and fill in the second event, Signed up. Then we’ll add a condition by clicking on the button that the red arrow is pointing to: 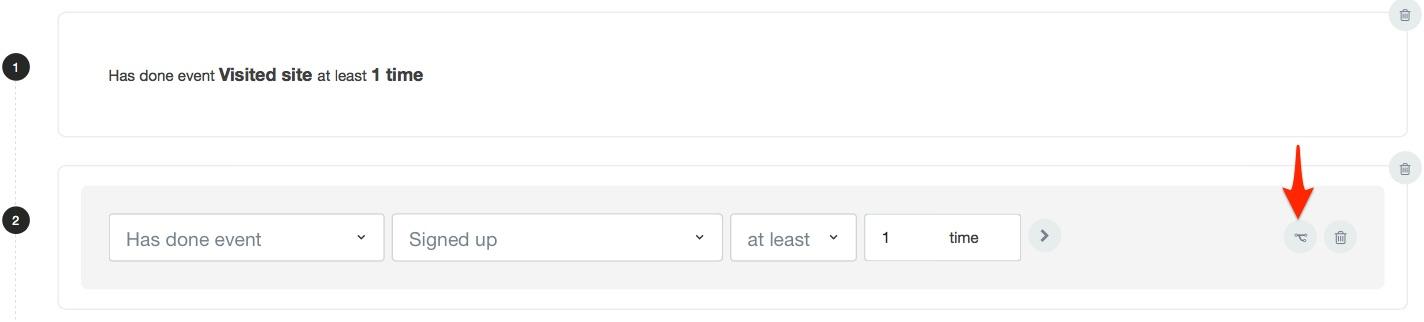 Click on that button and we’ll get to choose and/or conditions. 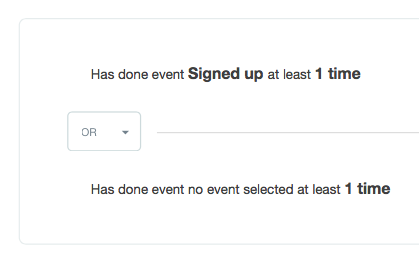 We’ll keep it as or and add the event Requested demo. This will ensure that regardless of whether a person signs up or requests a demo, they’ll be included in this funnel. 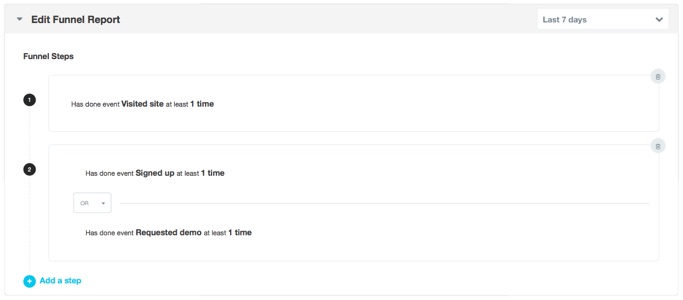 We’ll run the report and get our data: 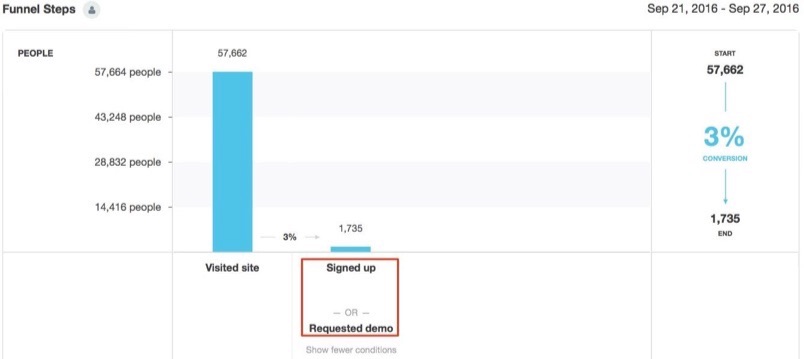 You can see that Signed up and Requested demo account for a 3% conversion rate. Want to see the individual numbers for each? No problem, just click on one of the two, and the Funnel Report will show you.  We can see that we’re getting a lot more signups than demo requests. We can take this even further by adding additional steps to our funnel report to see how one condition may affect the funnel. Let’s continue using this example to illustrate this important point. If the next steps after Signed up or Requested demo are activating the product and then upgrading, we can see how each condition affects the funnel. Let’s first look at how the funnel performs when people sign up: 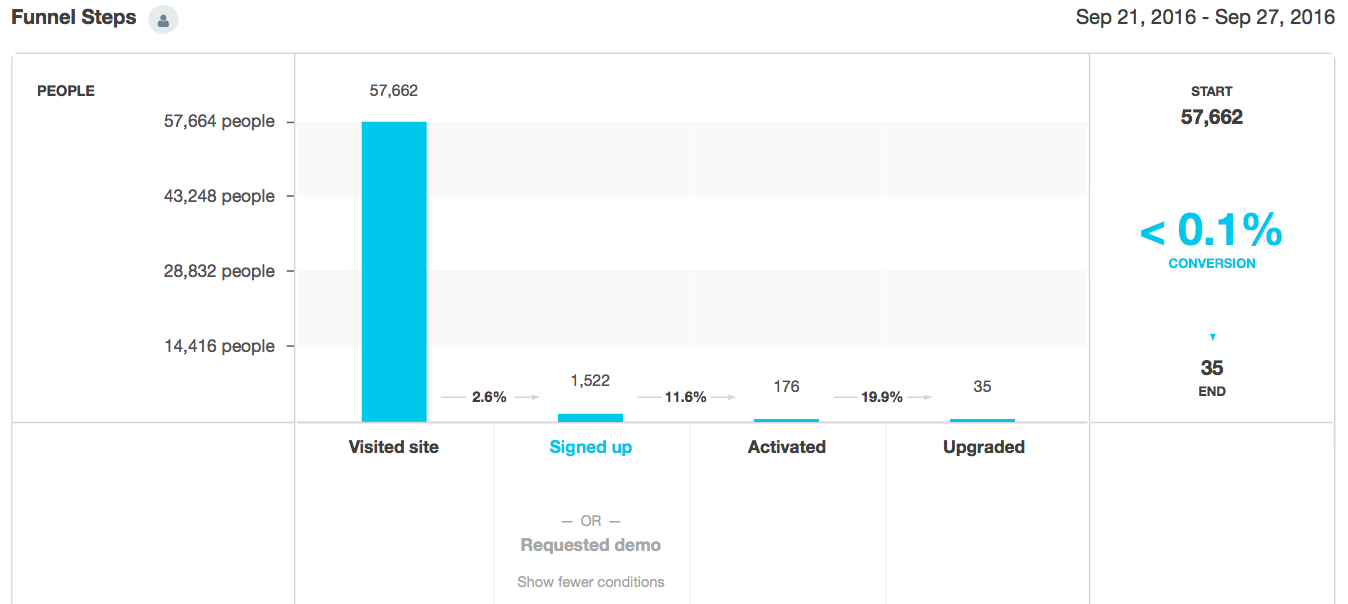 And now we’ll compare that to demo requests: 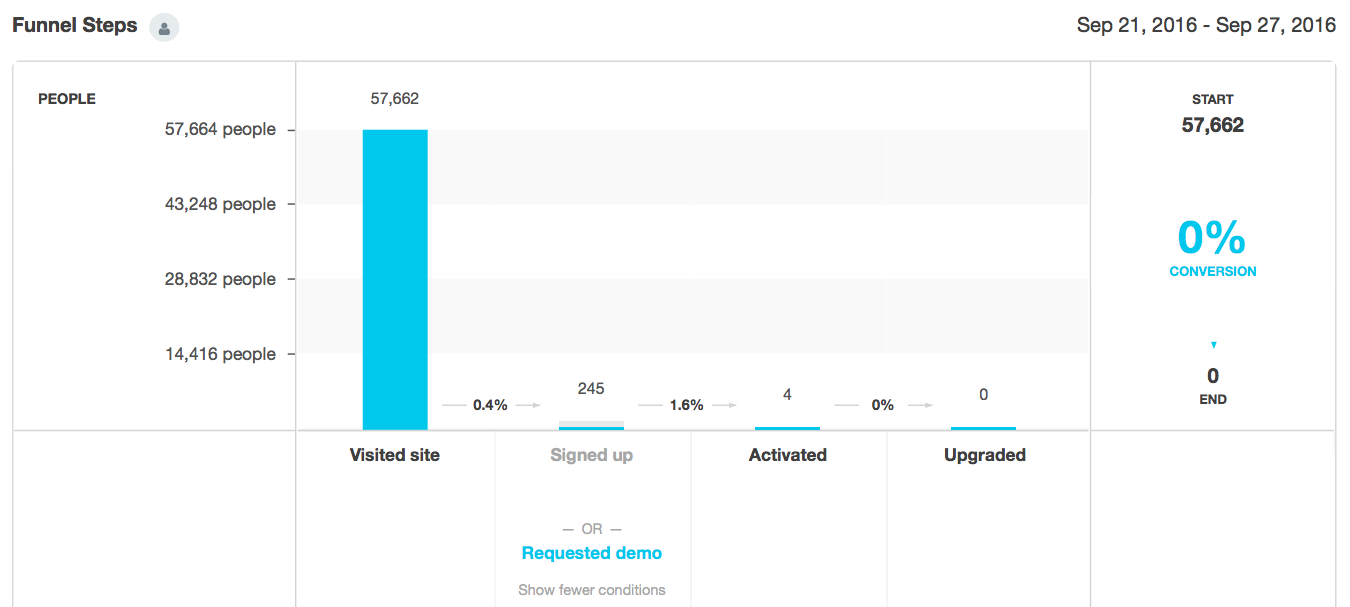 Big difference! We can see that while 245 people requested demos and 4 of those activated the product, 0 of them continued along in the funnel to paying for the product. All the success of the funnel is due to signups, not demo requests. As marketers, we now know we should focus more of our attention on driving signups and not demo requests. Now let’s do something similar with a property. We’ll look at all the signups and demo requests that came from San Francisco. Here’s how: Click on the arrow sign next to the condition: 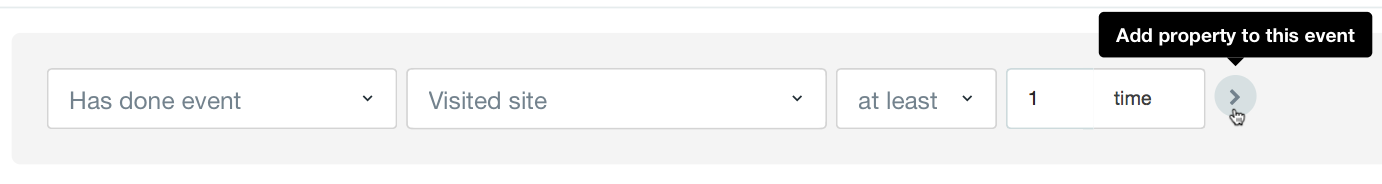 And we’ll add the property “KM City” with San Francisco: 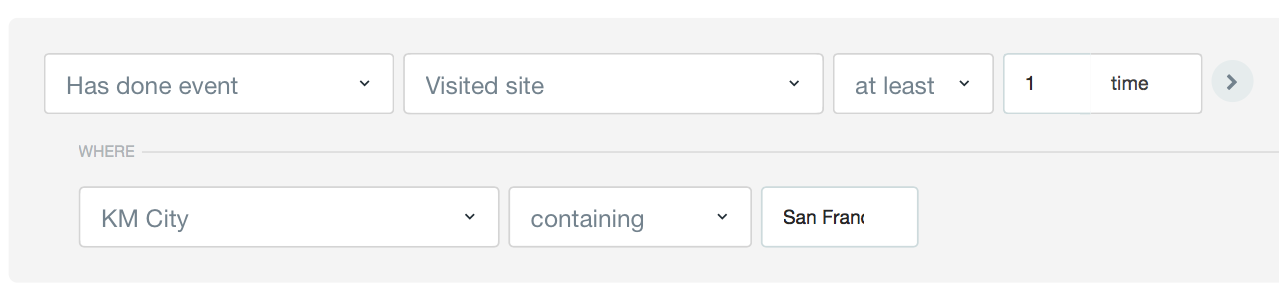 Visited site and KM City are automatically tracked in Kissmetrics. This means that we track it whenever someone visits your site, and we also look at what city they’re coming from. So this way we’re telling Kissmetrics to find all the people who visited our site who came from San Francisco. We’ll then add the second step in our funnel – finding those people who either signed up or requested a demo: 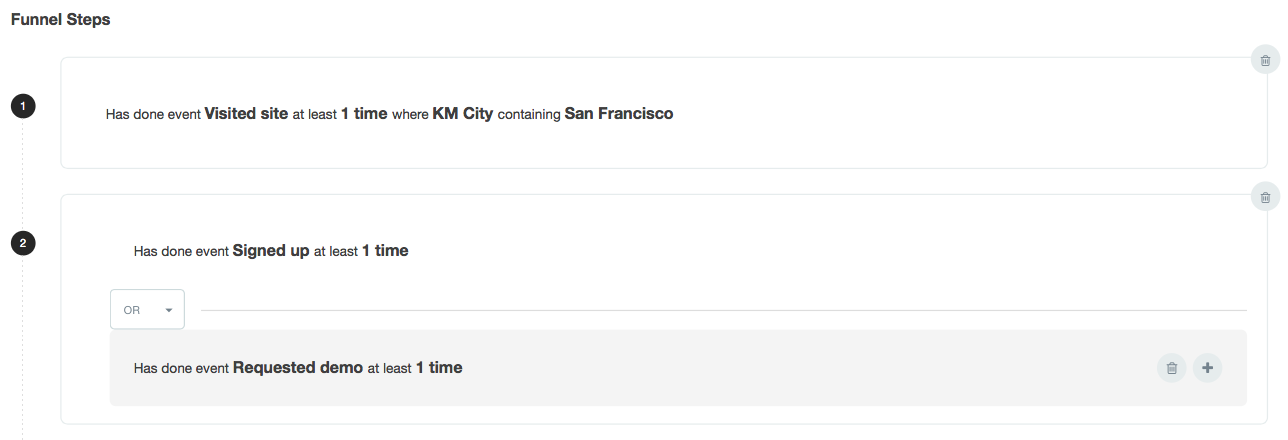 And run the report: 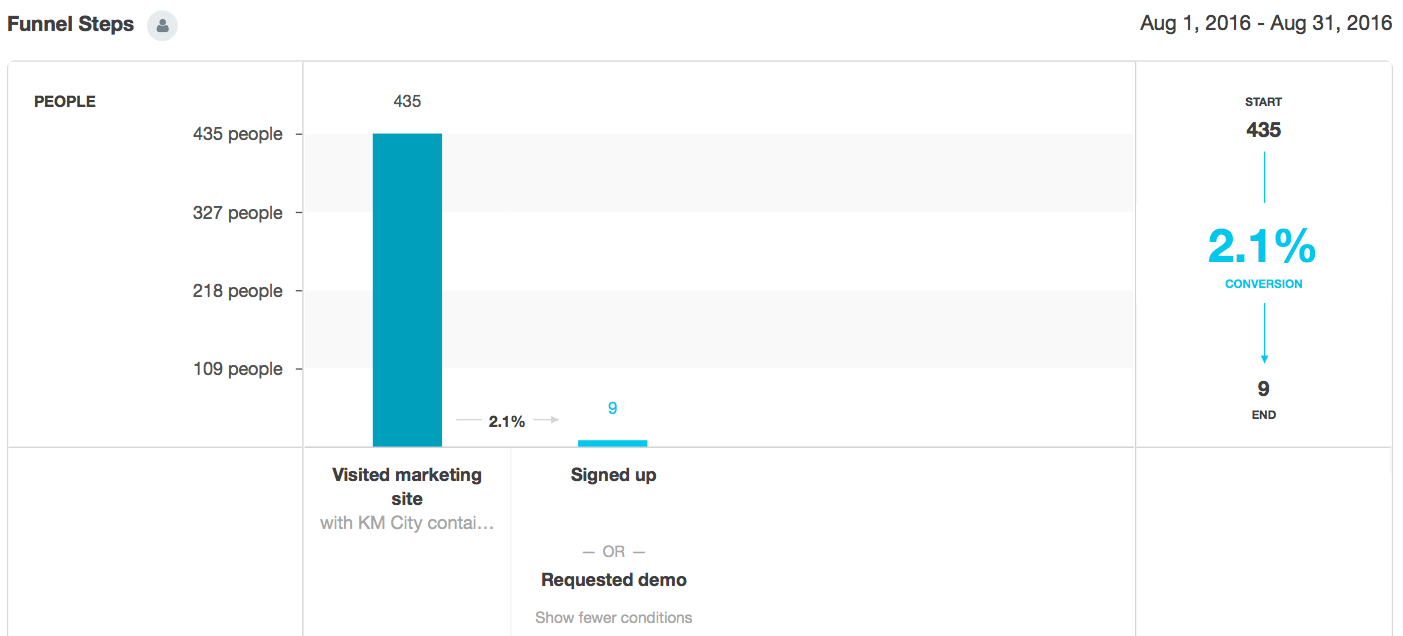 We can see that of the 435 people from San Francisco who visited our site during the selected date range, 9 of them converted to signing up or requesting a demo, giving us a 2.1% conversion rate. Let’s use one more example. Let’s say we just ran an ad campaign on 10 different sites. We are linking back to our site, and we tagged the URL with UTMs. We gave the "campaign source" as adsfall2016. Now we’ll create a funnel report that looks only at people who came from a UTM with that campaign source.  You can see that the first step we have in this funnel is finding the people who have visited the site and whose campaign source was adsfall2016. We’re also using the event Ad campaign hit, which triggers whenever someone comes from a URL with UTMs tagged. Ad campaign hit is automatically tracked in Kissmetrics along with any UTM parameters you have tagged. We’ll add two more steps – viewing a product and purchasing: 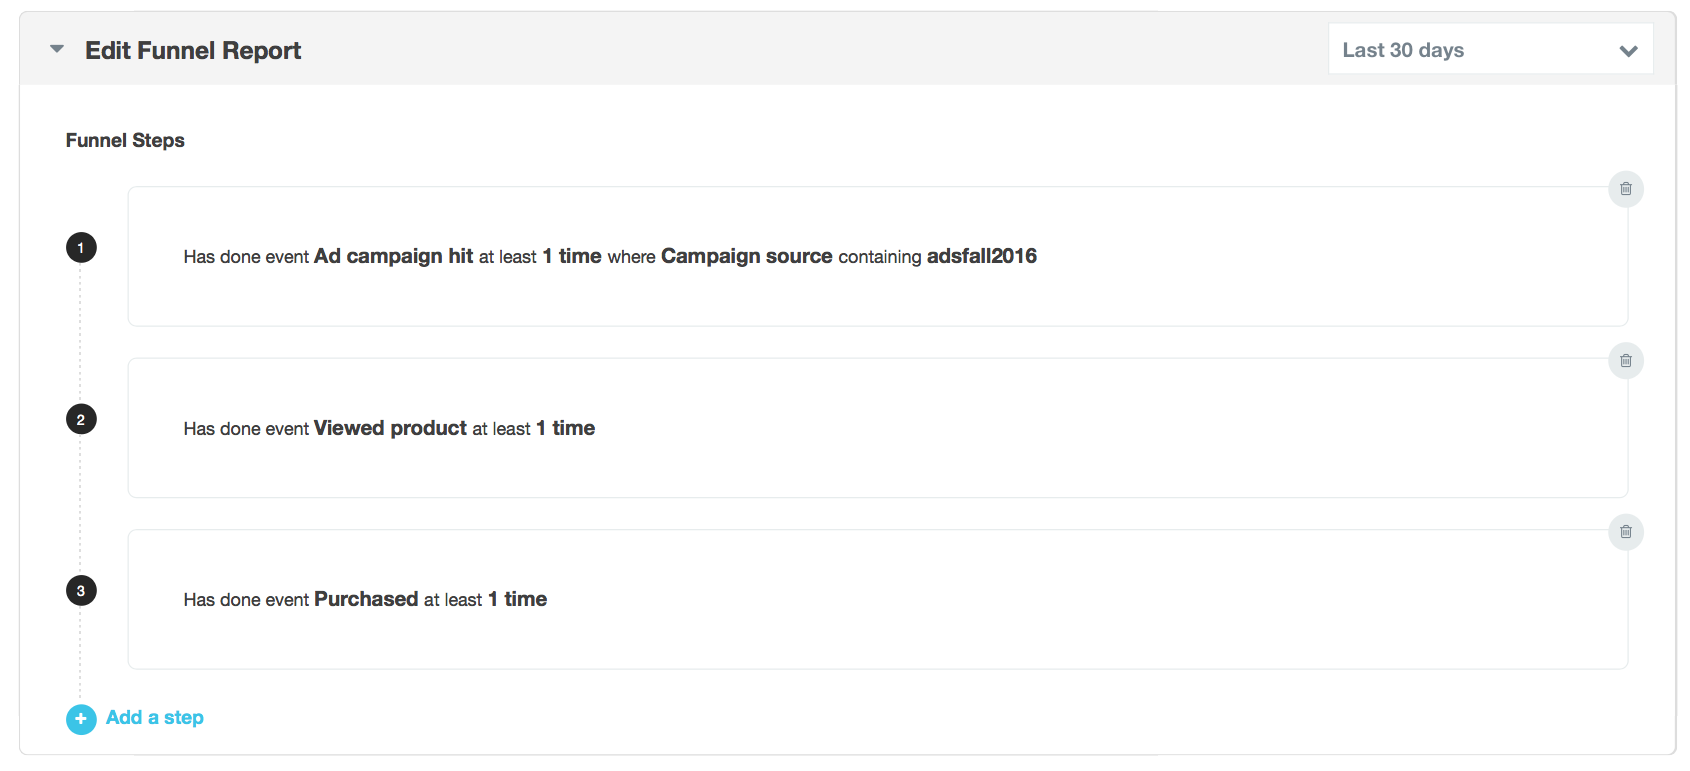 So now you can see how people progress through a funnel when they are coming from a campaign. 4. Numerical Values for PropertiesWe’ve added the ability to add numerical values to properties in the Funnel Report. Got all that? Here’s what it gets you: Say you’re an e-commerce marketer and you just launched your fall campaign. You want to see the conversion rate for the people who have visited your site and made a purchase of at least $99. We’ll add the property Order amount to the final step and tell Kissmetrics to find anyone who spent at least $99. 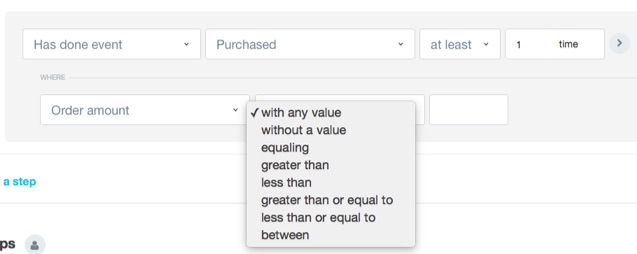 We’ll select the "greater than or equal to" option and place 99 in the text box: 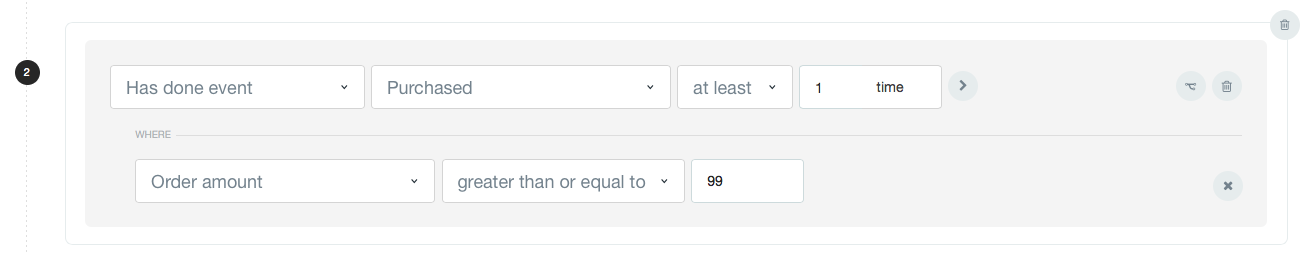 We’ll run the report and get our data: 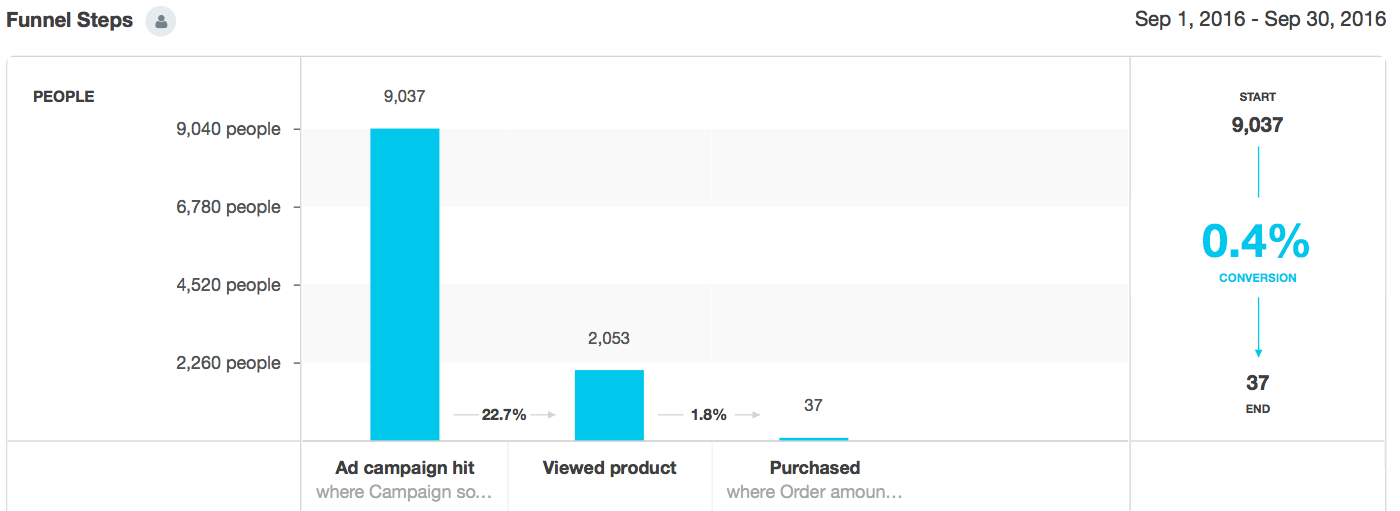 This will make finding a specific customer segment even easier. 5. People Who Do Not Have ConditionsWith our new Funnel Report, you can find people who have not done an event or do not have a property. So if you want to find the people who have signed up but have not viewed a product video, you can do that with the Funnel Report. Or, for another example, you can see the people who purchased who did not use a coupon code. Here’s how to do that: We’ll create a funnel report that looks at people who have visited our site, have not viewed our product video, and signed up. We’ll create our first step, Visited site, and then select people who have not done an event. We’ll choose Watched product video as the event. 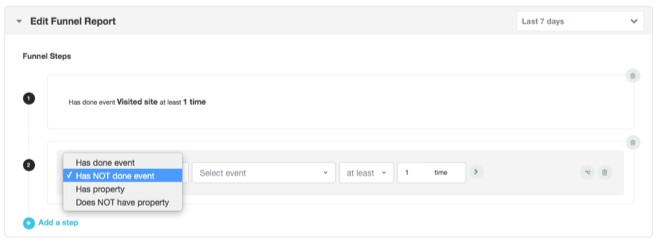 We’ll add the final step, Signed up, and make our date range the last 30 days: 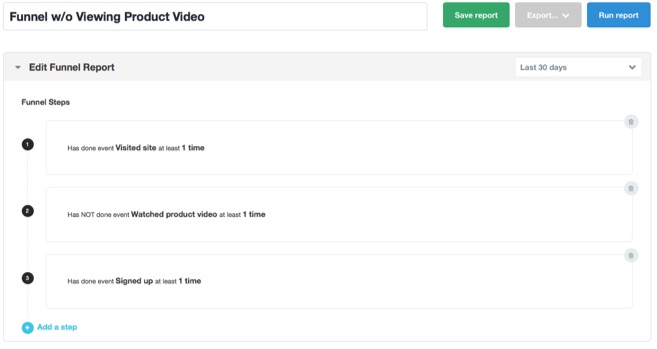 Now let’s get our data: 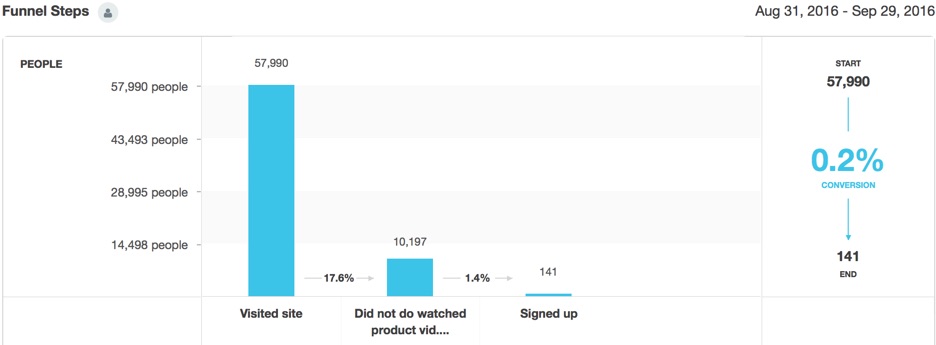 We see that a minority of people visiting our site do not view the product video before signing up. If we want to compare funnels by adding an or condition to our second step, we can do that too: 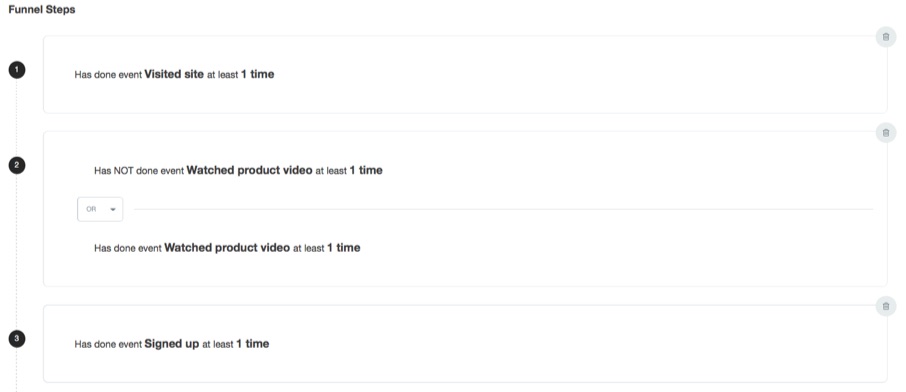 Now let’s run the report and click on “Watched product video” to compare the funnels: 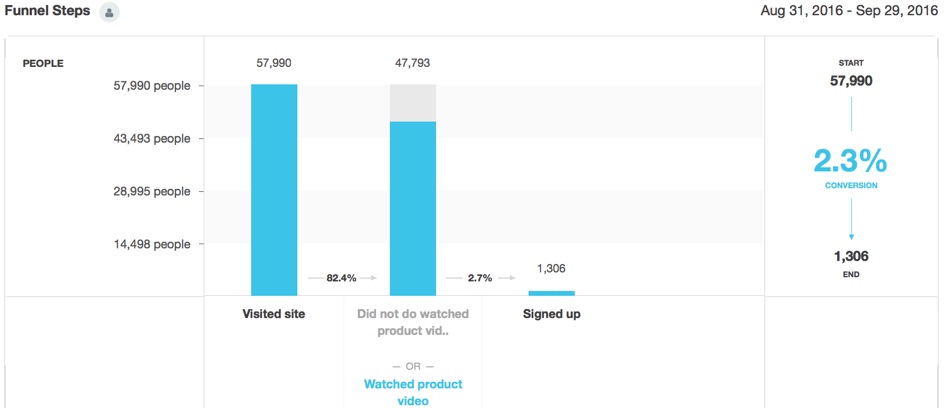 This shows us that most of the people who signed up had viewed the product video and that people who viewed the product video have a higher conversion rate (2.3% compared to .2%). If we want to improve our site and signups, we’ll want to consider showcasing the product video more prominently as it seems to be an effective conversion driver. Two Smaller ChangesFinally, we made two minor updates: 1. Design changes to advanced settingsPreviously you’d change your advanced settings here: 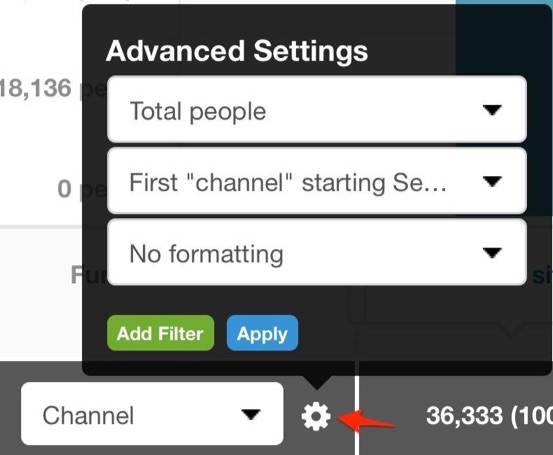 Now you’ll find those settings here: 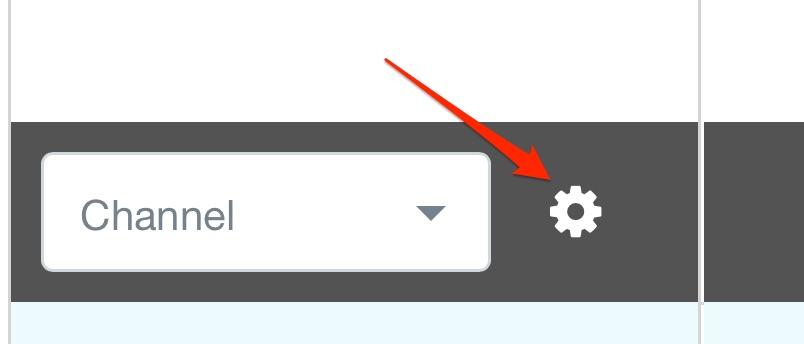 Click on that gear icon, and you'll see the attribution, formatting, and conversion rate options: 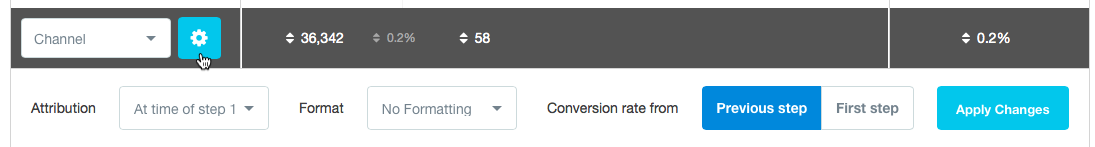 By default, the Funnel Report will display the conversion rate from the previous step. What's changed is that now you have the option to view the conversion rate from the first step. Here’s where you’ll find the conversion numbers: 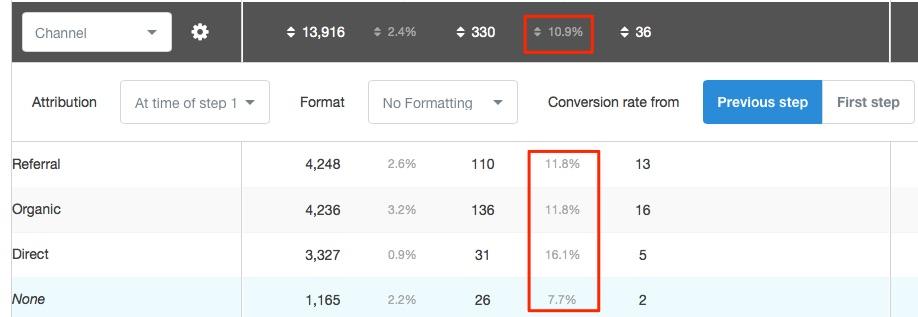 You can easily change the setting to see the conversion rate from the first step by clicking on the First step button: 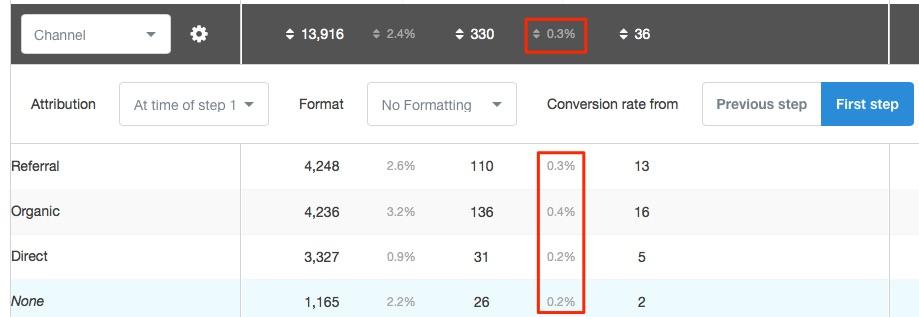 2. Checkbox changed to person iconIn some cases, people enter a funnel in a different order than the steps you have set up. For instance, you may have a funnel like this:
But what if a customer viewed a product video after signing up? Their steps are:
By default, the Funnel Report will exclude these people. But you can include them by checking this box: 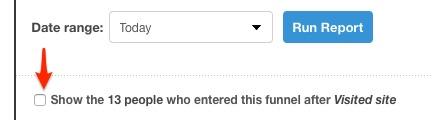 Now you’ll find that feature here: 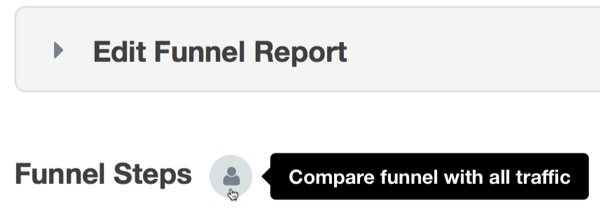 Click that icon and you’ll be able to compare the funnel with all traffic. Here’s how it looks:  Take the New Funnel Report for a SpinIf you’re already using Kissmetrics, you can sign in to your account, and the new Funnel Report will be ready for you. If you’re not already using Kissmetrics, this is a great time to get started. |
| You are subscribed to email updates from The Kissmetrics Marketing Blog. To stop receiving these emails, you may unsubscribe now. | Email delivery powered by Google |
| Google Inc., 1600 Amphitheatre Parkway, Mountain View, CA 94043, United States | |


